Perceptron
Our Java program implements a perceptron, a basic type of artificial neural network used for binary classification tasks. It trains the perceptron on a small dataset with two input features and corresponding binary labels, adjusting its weights and bias to make predictions and classify new input data based on the learned pattern. Similarly this is how we would use a perceptron to recognize facial/hand signals as a login.
Here’s an example of what a perceptron might look like:

Login/Signup Page (Ethan/Tay/Anthony)
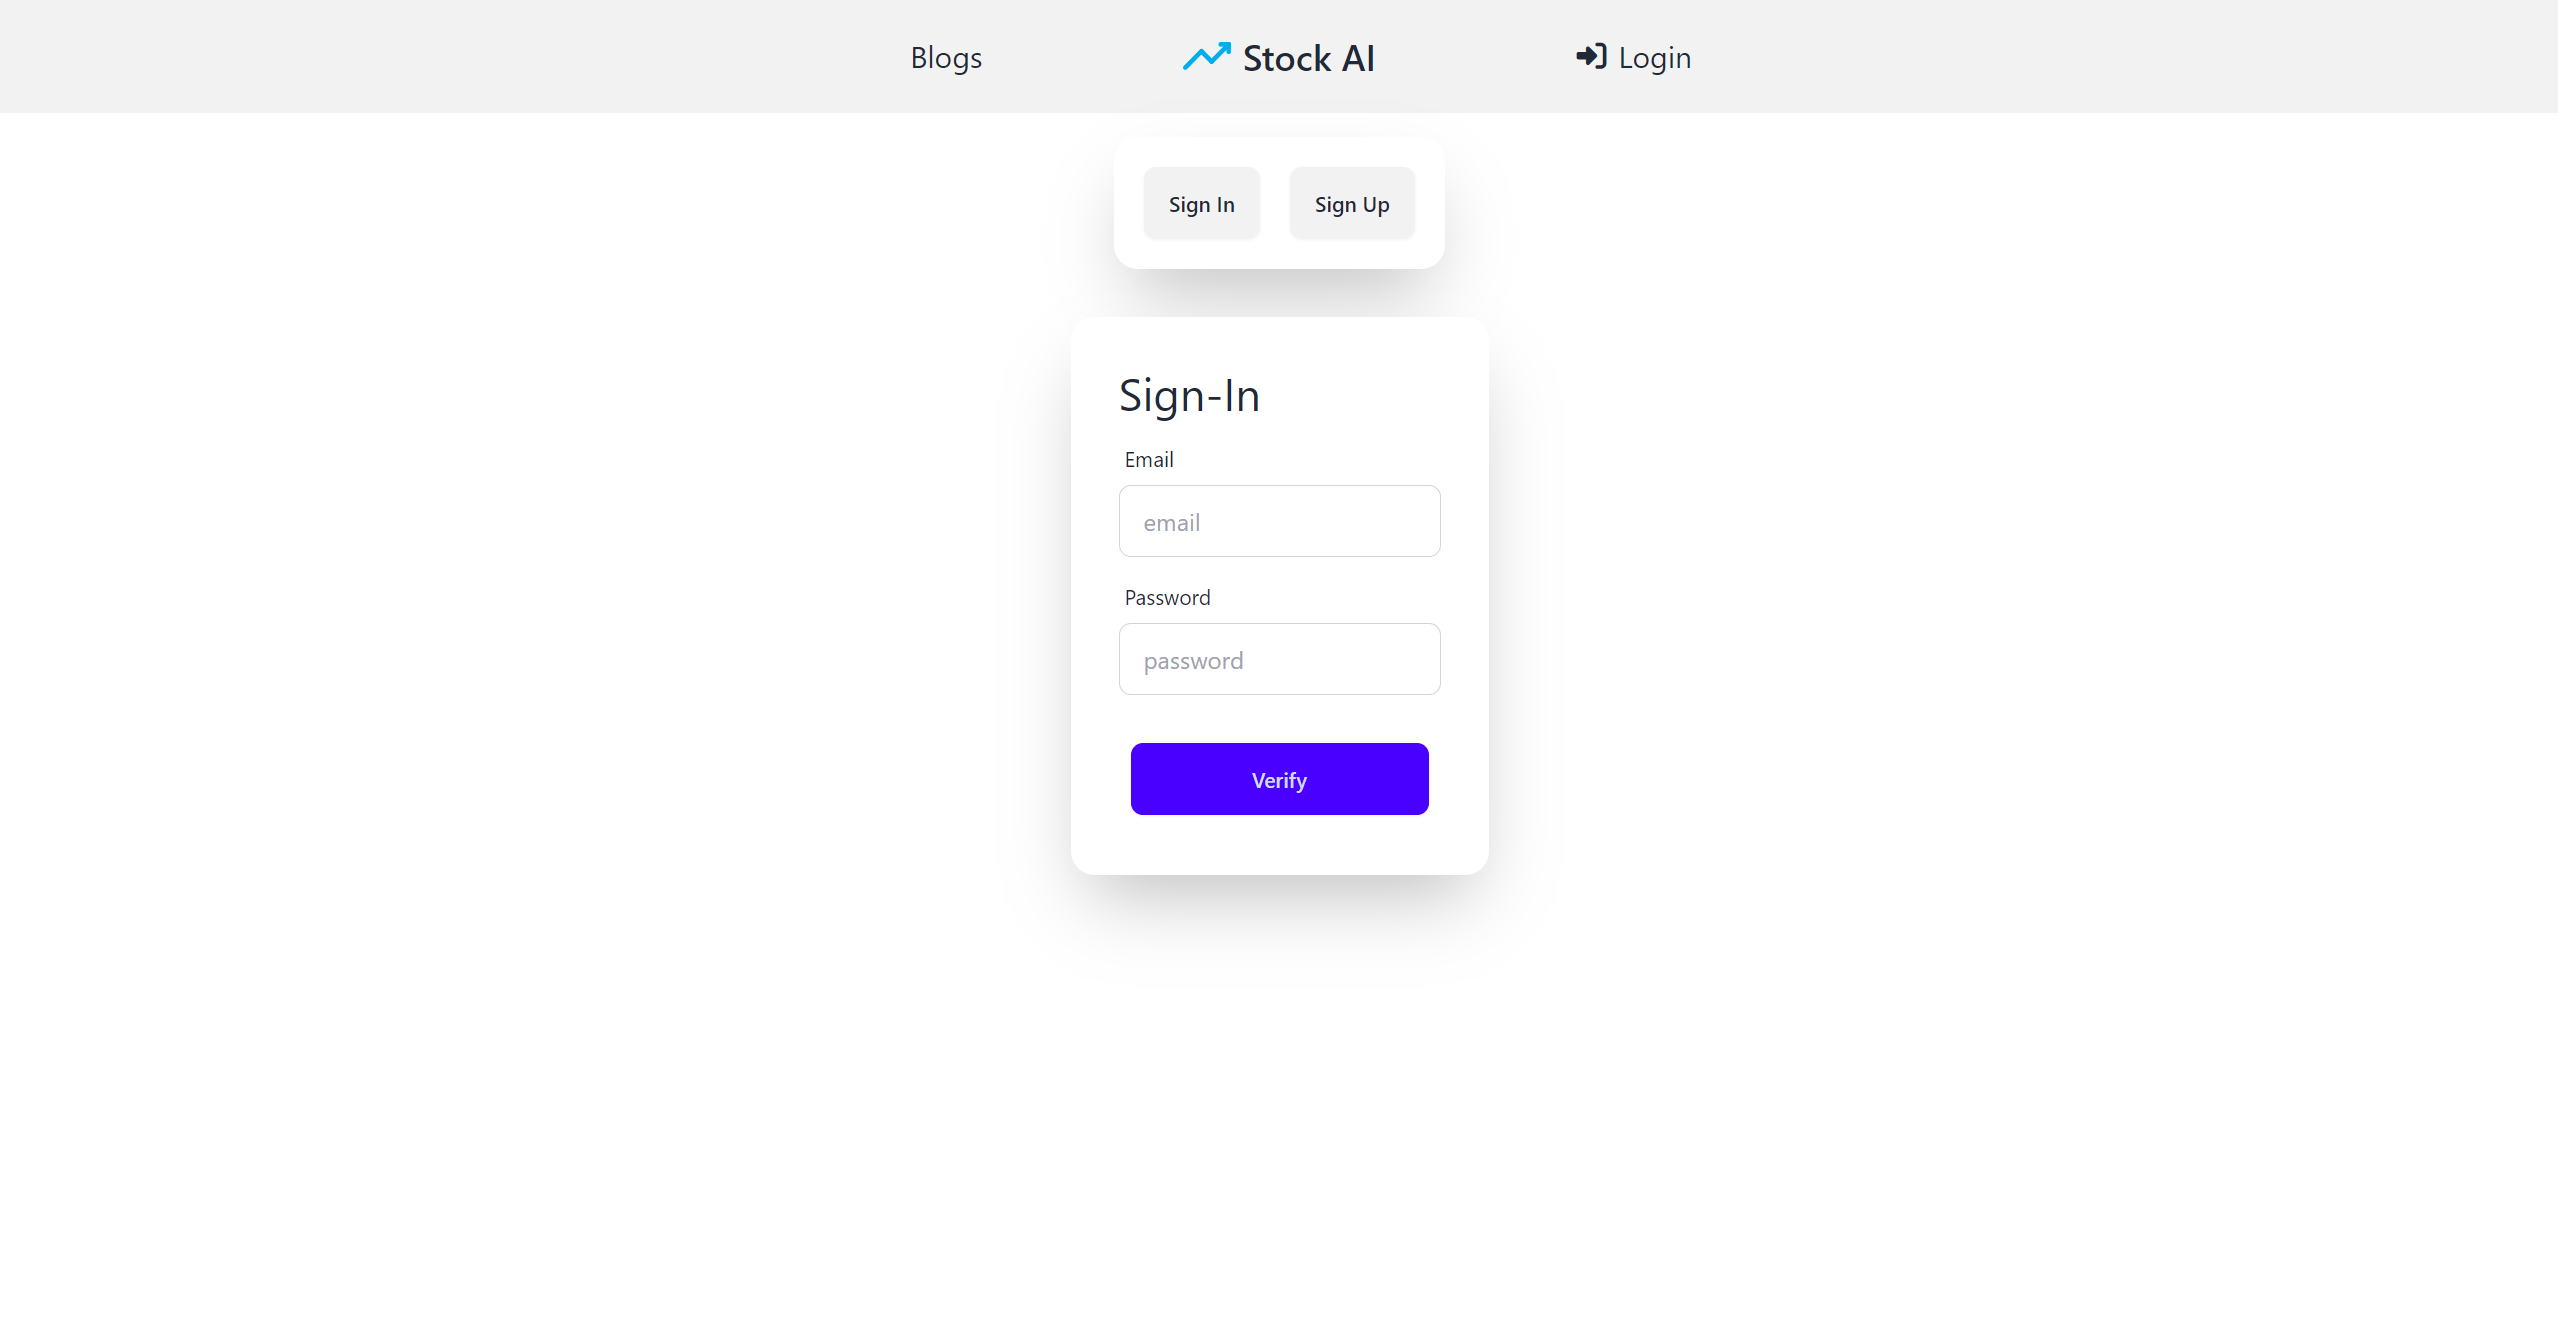
This was briefly demonstrated during our presentation at N@TM, but essentially what happens is that the user will show a particular hand motion to the camera, and the program for frames will capture that photo and display many different versions of this. Later on, this image will be useful, as it will be used to show that the account with that particular hand motion belongs to that person.
Market Page (Jishnu)
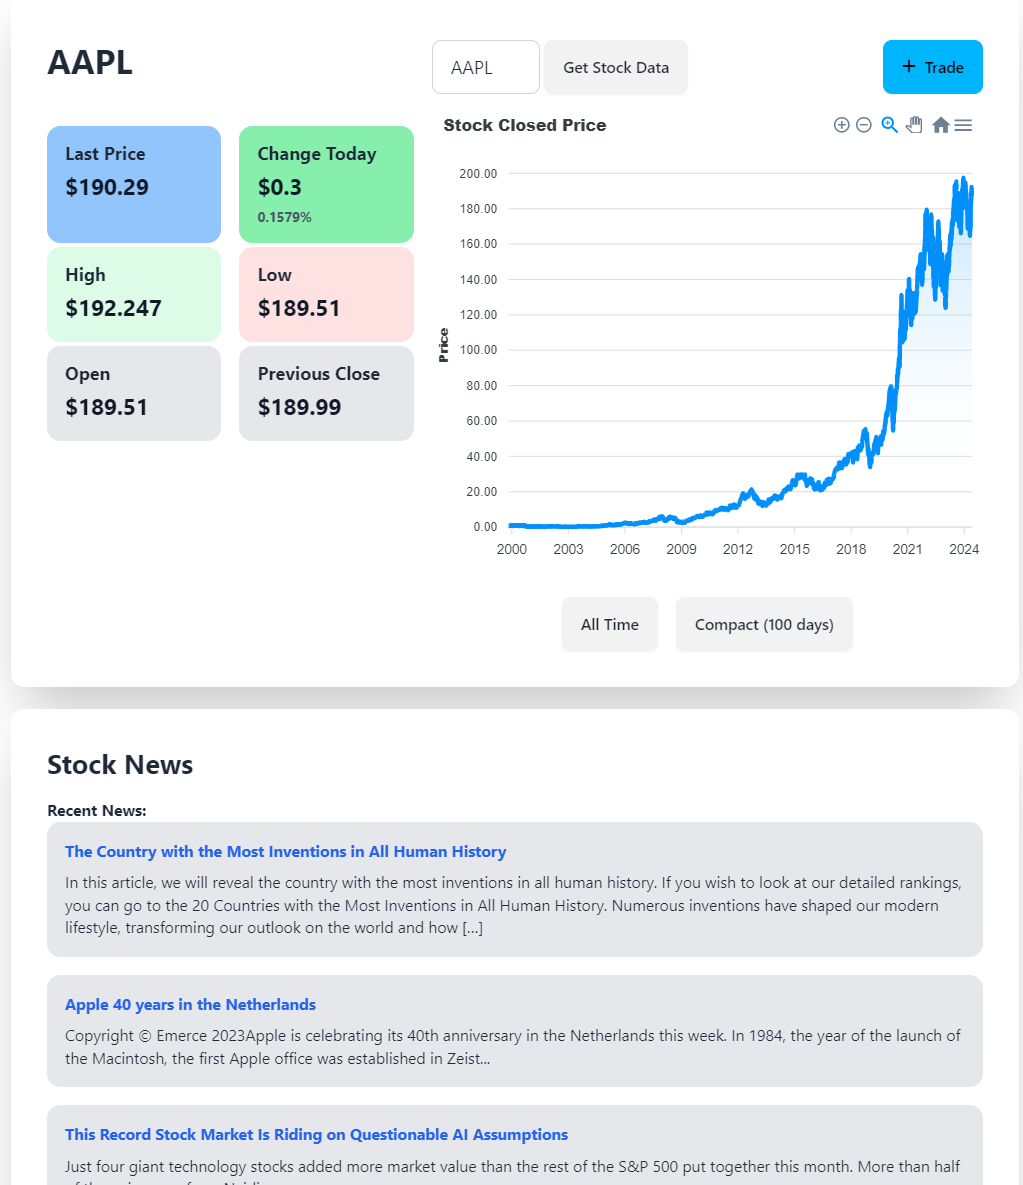
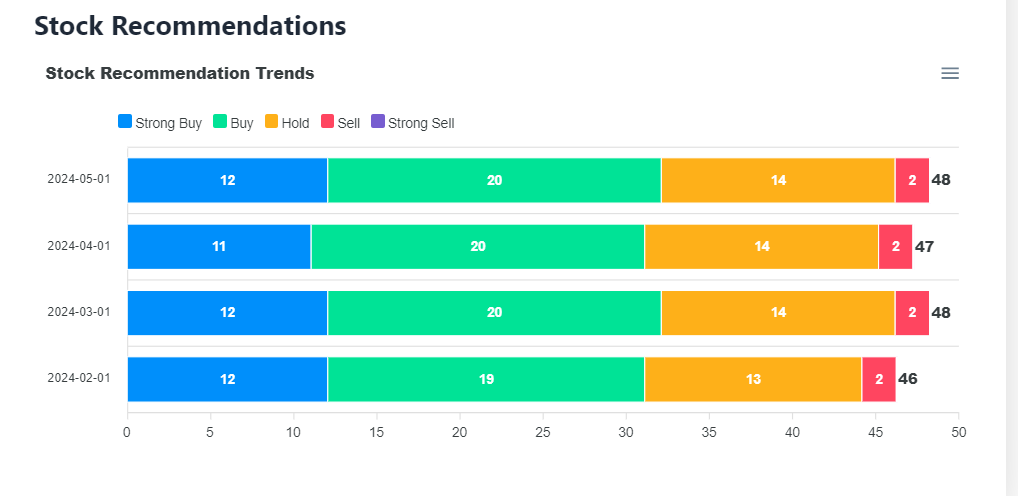
The market page is probably one of the most important features of our project, as it is the feature that allows us to not only view the data for a variety of companies over several years, but to also see some recommended stock news related to the inputted company as well as some stock recommendations. The model is using data from over the past 10 years in order to help predict the model’s behavior later on, and with the Python version, it has been very accurate to the actual values in the stock market.
Stock Dashboard (Me)
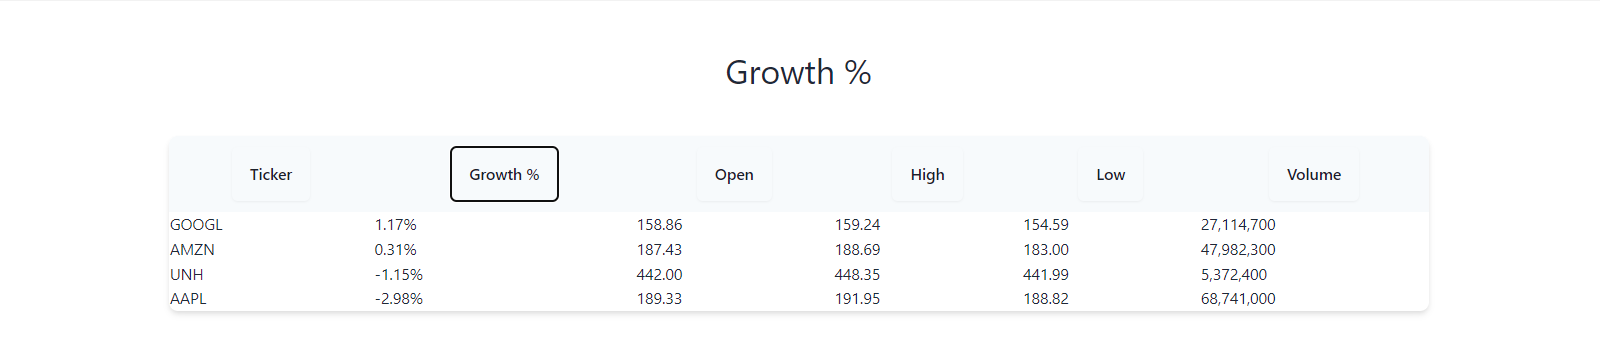
With the stock dashboard feature, the table includes several companies (and their tickers in the stock market) along with some specific attributes associated with them (opening price, highest price, volume of shares, etc.). This is important to the project because seeing this data will inform the user on what company or set of companies they should invest in and what factors they should take into account when deciding which one to invest in.
Leaderboard (Me and Krishiv)
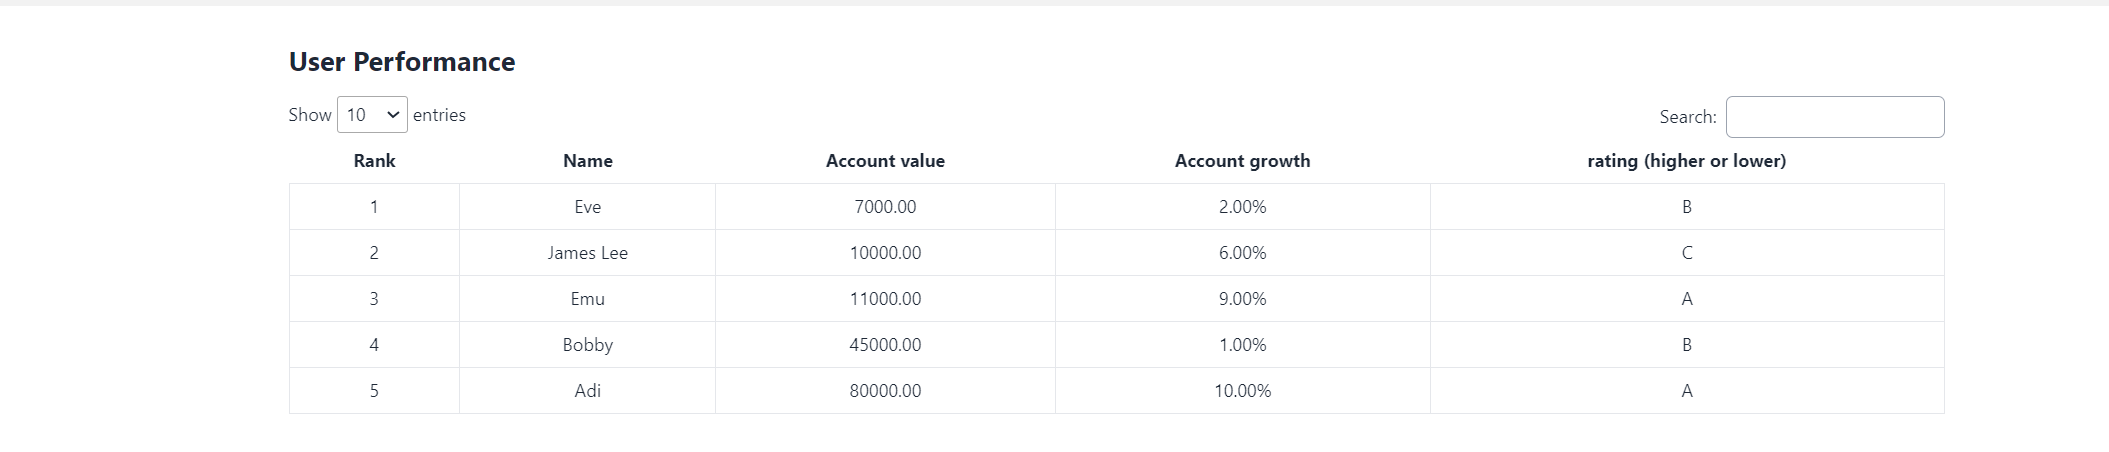
This feature definitely took me and Krishiv the longest time to figure out, as one of the big problems associated with the leaderboard was not being able to display data added to the leaderboard. Eventually, we realized that we forgot to add a @Postmapping to the Leaderboard’s API Controller, which was ultimately a quick fix and allowed us to have a leaderboard with its desired functionality, as shown below:
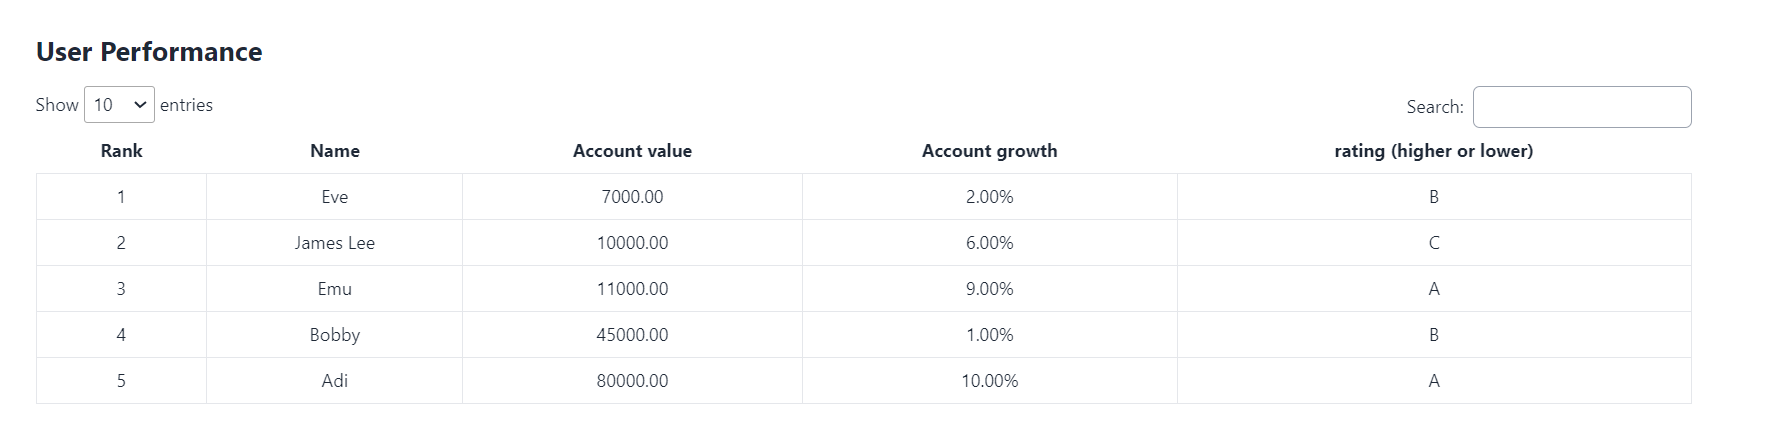
The leaderboard sorts users by their accountValue, with the lowest account values being near the top and the highest account values being near the bottom. However, other variables are included, such as the user’s account growth as well as their rating from A to D, with A being the highest rating and D being the lowest rating.
Reflection
Overall, not only did I of course learn a lot about the stock market through this project, I also ended up learning a considerable amount about machine learning algorithms (such as LSTM and MNIST used here) that would definitely be applicable to several internships/jobs I will apply to in the future. A project like this is definitely outside of my comfort zone (at least compared to previous projects), so it was really interesting to be challenged this time to be able to learn something new.
#